06_Proptech
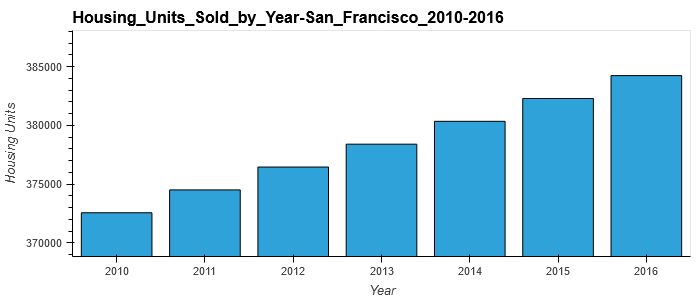
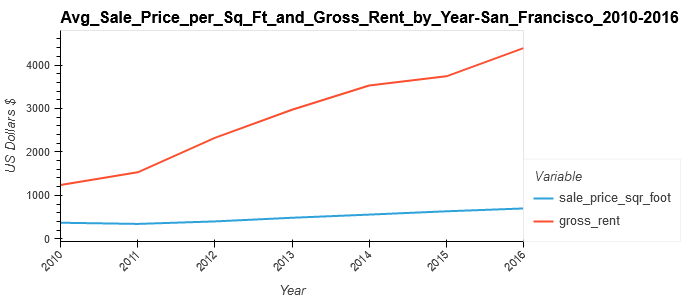
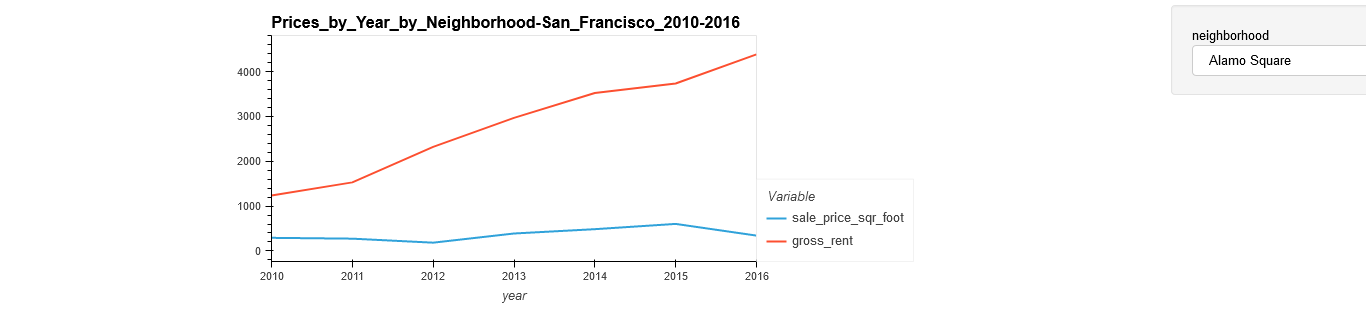
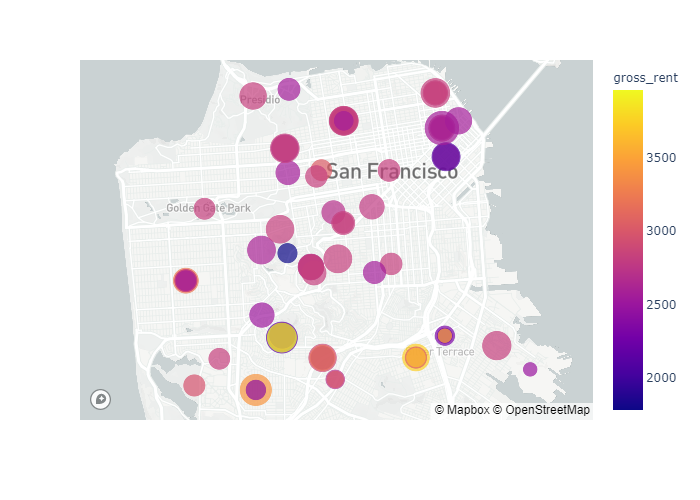
Jupyter notebook analyzing housing rental market data with interactive visualizations using PyViz, Plotly, and the Mapbox API.
Technologies
- PyViz
- The Mapbox API
Installation Instructions
Create a new conda environment to avoid conflicts with other package installations:
conda deactivate
conda update conda
conda create -n pyviz python=3.7 anaconda
conda activate pyviz
Install PyViz packages:
conda install -c plotly plotly=4.13.
conda install -c pyviz hvplot
- PyViz require NodeJS version >= 12
conda install -c conda-forge nodejs=12Install required JupyterLab Dependencies:
conda install -c conda-forge jupyterlab=2jupyter labextension install jupyterlab-plotly@4.13.0 --no-buildjupyter labextension install @jupyter-widgets/jupyterlab-manager plotlywidget@4.13.0 --no-buildjupyter labextension install @pyviz/jupyterlab_pyviz --no-buildjupyter lab buildInstall python-dotenv
pip install python-dotenv
Examples
Contributors
Starter code was given in the Rice FinTech Bootcamp and all modifications were made by Remy Dillenseger.
License
This project is licensed under the MIT License. Click Here for more information.